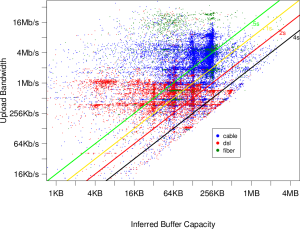
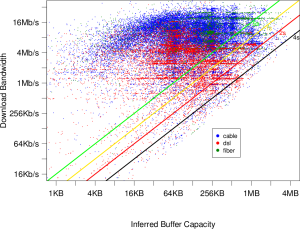
Bufferbloat is present in all of the broadband technologies, cable, DSL and FIOS alike. And bufferbloat is present in other parts in the Internet as well.
As may be clear from old posts here, I’ve had lots of network trouble at my home, made particularly hard to diagnose due to repetitive lightning problems. This has caused me to buy new (and newer) equipment over the last five years (and experience the fact that bufferbloat has been getting worse in all its glory). It also means that I can’t definitively answer all questions about my previous problems, as almost all of that equipment is scrap.
Debugging my network
As covered in my first puzzle piece I was investigating performance of an old VPN device Bell Labs had built last April, and found that the latency and jitter when running at full speed was completely unusable, for reasons I did not understand, but had to understand for my project to succeed. The plot thickened when I discovered I had the same terrible behavior without using the Blue Box.I had had an overnight trip to the ICU in February; so did not immediately investigate then as I was catching up on other work. But I knew I had to dig into it, if only to make good teleconferencing viable for me personally. In early June, lightning struck again (yes, it really does strike in the same place many times). Maybe someone was trying to get my attention on this problem. Who knows? I did not get back to chasing my network problem until sometime in late June, after partially recovering my home network, further protecting my house, fighting with Comcast to get my cable entrance relocated (the mom-and-pop cable company Comcast had bought had installed it far away from the power and phone entrance), and replacing my washer, pool pump, network gear, and irrigation system.
But the clear signature of the criminal I had seen on April had faded. Despite several weeks of periodic attempts, including using the wonderful tool smokeping to monitor my home network, and installing it in Bell Labs, I couldn’t nail down what I had seen again.I could get whiffs of smoke of the the unknown criminal, but not the same obvious problems I had seen in April. This was puzzling indeed; the biggest single change in my home network had been replacing the old blown cable modem provided by Comcast with a new faster DOCSIS 3 Motorola SB6120 I bought myself.
In late June, my best hypothesis was that there might be something funny going on with Comcast’s PowerBoost® feature. I wondered how that worked, did some Googling, and happened across the very nice internet draft that describes how Comcast runs and provisions its network. When going through the draft, I happened to notice that one of the authors lives in an adjacent town, and emailed him, suggesting lunch and a wide ranging discussion around QOS, Diffserv, and the funny problems I was seeing. He’s a very senior technologist in Comcast. We got together in mid-July for a very wide ranging lunch lasting three hours.
Lunch with Comcast
Before we go any further…Given all the Comcast bashing currently going on, I want to make sure my readers understand through all of this Comcast has been extremely helpful and professional, and that the problem I uncovered, as you will see before the end of this blog entry, are not limited to Comcast’s network: bufferbloat is present in all of the broadband technologies, cable, FIOS and DSL alike.
The Comcast technical people are as happy as the rest of us that they now have proof of bufferbloat and can work on fixing it, and I’m sure Comcast’s business people are happy that they are in a boat the other broadband technologies are in (much as we all wish the mistake was only in one technology or network, it’s unfortunately very commonplace, and possibly universal). And as I’ve seen the problem in all three common operating systems, in all current broadband technologies, and many other places, there is a lot of glasse around us. Care with stones is therefore strongly advised.
The morning we had lunch, I happened to start transferring the old X Consortium archives from my house to an X.org system at MIT (only 9ms away from my house; most of the delay is in the cable modem/CMTS pair); these archives are 20GB or so in size. All of a sudden, the wiffs of smoke I had been smelling became overpowering to the point of choking and death. ”The Internet is Slow Today, Daddy” echoed through my mind; but this was self inflicted pain. But as I only had an hour before lunch, the discussion was a bit less definite than it would have been even a day later. Here is the “smoking gun” of the following day, courtesy of DSL Reports Smokeping installation. You too can easily use this wonderful tool to monitor the behavior of your home network from the outside.
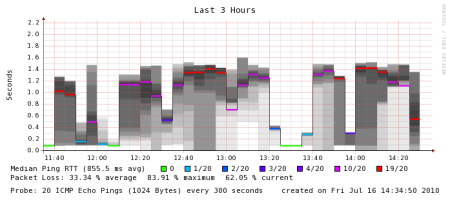 As you can see, I had well over one second latency, and jitter just as bad, along with high ICMP packet poss. Behavior from inside out looked essentially identical. The times when my network connection returned to normal were when I would get sick of how painful it was to browse the web and suspend the rsync to MIT. As to why the smoke broke out, the upstream transfer is always limited by the local broadband connection: the server is at MIT’s colo center on a gigabit network, that directly peers with Comcast. It is a gigabit (at least) from Comcast’s CMTS all the way to that server (and from my observations, Comcast runs a really clean network in the Boston area. It’s the last mile that is the killer.
As part of lunch, I was handed a bunch of puzzle pieces that I assembling over the following couple months. These included:
- That what I was seeing was more likely excessive buffering in the cable system, in particular, in cable modems. Comcast has been trying to get definitive proof of this problem since Dave Clark at MIT had brought this problem to their attention several years ago.
- A suggestion of how to rule in/out the possibility of problems from Comcast’s Powerboost by falling back to the older DOCSIS 2 modem.
- A pointer to ICSI’s Netalyzr.
- The interesting information that some/many ISP’s do not run any queue management (e.g. RED).
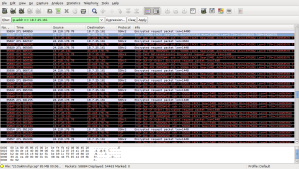
But it had been more than a decade since I last tried taking packet captures, and was staring at TCP traces. Wireshark was immediately a big step up (I’d occasionally played with it over the last decade); as soon as I took my first capture I immediately knew something was gravely wrong despite being very rusty at staring at traces. In particular, there were periodic bursts of illness, with bursts of dup’ed acks, retransmissions, and reordering. I’d never seen TCP behave in such a bursty way (for long transfers). So I really wanted to see visually what was going on in more detail. After wasting my time investigating more modern tools, I settled on the old standby’s of tcptrace and xplot I had used long before. There are certainly more modern tools; but most are closed source and require Microsoft Windows. Acquiring the tools, and their learning curve (and the fact I normally run Linux) mitigated against their use.
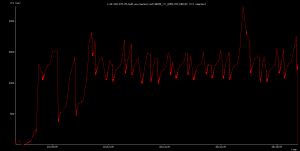
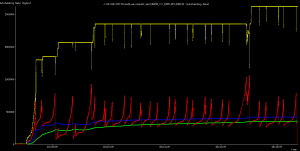
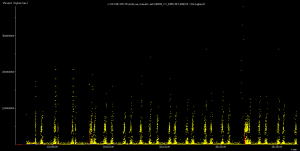
A number of plots show the results. The RTT becomes very large after a while (10-20 seconds) into the connection, just as the ICMP ping results go.. The outstanding data graph and throughput graph show the bursty behavior so obvious even browsing the wireshark results. Contrast this with the sample RTT, outstanding data graph and throughput graphs from the TCP trace manual.
Also remember that buffering in one direction still causes problems in the other direction; TCP’s ack packets will be delayed. So my occasional uploads (in concert with the buffering) was causing the “Daddy, the Internet is slow today” phenomena; the opposite situation is of course also possible.
The Plot Thickens Further
Shortly after verifying my results on cable, I went to New Jersey (I work for Bell Labs from home, reporting to Murray Hill), where I stay with my in-laws in Summit. I did a further set of experiments. When I did, I was monumentally confused (for a day), as I could not reproduce the strong latency/jitter signature (approaching 1 second of latency and jitter) that I saw my first day there when I went to take the traces. With a bit of relief, I realized that the difference was that I had initially been running wireless, and then had plugged into the router’s ethernet switch (which has about 100ms of buffering) to take my traces. The only explanation that made sense to me was that the wireless hop had additional buffering (almost a second’s worth) above and beyond that present in the FIOS connection itself. This sparked my later investigation of routers (along with occasionally seeing terrible latency in other routers), which in turn (when the results were not as I had naively expected, sparked investigating base operating systems.The wireless traces are much rattier in Summit: there are occasional packet drops severe enough to cause TCP to do full restarts (rather than just fast retransmits), and I did not have the admin password on the router to shut out other access by others in the family. But the general shape in both are similar to that I initially saw at home.
Ironically, I have realized that you don’t see the full glory of TCP RTT confusion caused by buffering if you have a bad connection as it reset TCP’s timers and RTT estimation; packet loss is always considered possible congestion. This is a situation where the “cleaner” the network is, the more trouble you’ll get from bufferbloat. The cleaner the network, the worse it will behave. And I’d done so much work to make my cable as clean as possible…
At this point, I realized what I had stumbled into was serious and possibly widespread; but how widespread?
Calling the consulting detectives
At this point, I worried that we (all of us) are in trouble, and asked a number of others to help me understand my results, ensure their correctness, and get some guidance on how to proceed. These included Dave Clark, Vint Cerf, Vern Paxson, Van Jacobson, Dave Reed, Dick Sites and others. They helped with the diagnosis from the traces I had taken, and confirmed the cause. Additionally, Van notes that there is timestamp data present in the packet traces I took (since both ends were running Linux) that can be used to locate where in the path the buffering is occurring (though my pings are also very easy to use, they may not be necessary by real TCP wizards, which I am not, and begs a question of accuracy if the nodes being probed are loaded).Dave Reed was shouted down and ignored over a year ago when he reported bufferbloat in 3G networks (I’ll describe this problem in a later blog post; it is an aggregate behavior caused by bufferbloat). With examples in broadband and suspicions of problems in home routers I now had reason to believe I was seeing a general mistake that (nearly) everyone is making repeatedly. I was concerned to build a strong case that the problem was large and widespread so that everyone would start to systematically search for bufferbloat. I have spent some of the intervening several months documenting and discovering additional instances of bufferbloat, as my switch, home router, results from browser experiments, and additional cases such as corporate and other networks as future blog entries will make clear.
ICSI Netalyzr
One of the puzzle pieces handed me by Comcast was a pointer to Netalyzr.ICSI has built the wonderful Netalyzr tool, which you can use to help diagnose many problems in your ISP’s network. I recommend it very highly. Other really useful network diagnosis tools can be found at M-Lab and you should investigate both; some of the tests can be run immediately from a browser (e.g. netalyzr), but some tests are very difficult to implement in Java. And by using these tools, you will also be helping researchers investigate problems in the Internet, and you may be able to discover and expose mis-behavior of many ISP’s. I have, for example, discovered that the network service provided on the Acela Express is running a DNS server which is vulnerable to man-in-the-middle attacks due to lack of port randomization, and therefore will never consider doing anything on it that requires serious security.
At about the same time as I was beginning to chase my network problem, the first netalyzer results were published at NANOG; more recent results have since been published. Netalyzr: Illuminating The Edge Network, by Christian Kreibich, Nicholas Weaver, Boris Nechaev, and Vern Paxson. This paper has a wealth of data in it on all sorts of problems that Netalyzr has uncovered; excessive buffering is caused in section 5.2. The scatterplot there and the discussion is worth reading. Courtesy of the ICSI group, they have sent me a color version of that scatterplot that makes the technology situation much clearer (along with the magnitude of the buffering) which they have used in their presentations, but is not in that paper. Without this data, I would have still been wondering bufferbloat was widespread, and whether it was present in different technologies or not. My thanks to them for permission to post these scatter plots.
As outlined in the Netalyzr paper in section 5.2, the structure you see is very useful to see what buffer sizes and provisioned bandwidths are common. The diagonal lines indicate the latency (in seconds!) caused by the buffering. Both wired and wireless Netalyzer data are mixed in the above plots. The structure shows common buffer sizes, that are sometimes as large as a megabyte. Note that there are times that Netalyzr may have been under-detecting and/or underreporting the buffering, particularly on faster links; the Netalyzr group have been improving its buffer test.
I do have one additional caution, however: do not regard the bufferbloat problem as limited to interference cause by uploads. Certainly more bandwidth makes the problem smaller (for the same size buffers); the wired performance of my FIOS data is much better than what I observe for Comcast cable when plugged directly into the home router’s switch. But since the problem is present in the wireless routers often provided by those network operators, the typical latency/jitter results for the user may in fact be similar, even though the bottleneck may be in the home router’s wireless routing rather than the broadband connection. Anytime the downlink bandwidth exceeds the “goodput” of the wireless link that most users are now connected by, the user will suffer from bufferbloat in the downstream direction in the home router (typically provided by Verizon) as well as upstream (in the broadband gear) on cable and DSL. I see downstream bufferbloat commonly on my Comcast service too, now that I’ve upgraded to 50/10 service, now that it is much more common my wireless bandwidth is less than the broadband bandwidth.
Discarding various alternate hypotheses
You may remember that I started this investigation with a hypothesis that Comcast’s Powerboost might be at fault. This hypothesis was discarded by dropping my cable service back to using DOCSIS 2 (which would have changed the signature in a different way when I did).Secondly, those who have waded through this blog will have noted that I have had many reasons not to trust the cable to my house, due to mis-reinstallation of a failed cable by Comcast earlier, when I moved in. However, the lightning events I have had meant that the cable to my house was relocated this summer, and a Comcast technician had been to my house and verified the signal strength, noise and quality at my house. Furthermore, Comcast verified my cable at the CMTS end; there Comcast saw a small amount of noise (also evident in (some of) the packet traces by occasional packet loss) due to the TV cable also being plugged in (the previous owner of my house loved TV, and the TV cabling wanders all over the house). For later datasets, I eliminated this source of noise, and the cable tested clean at the Comcast end and the loss is gone in subsequent traces. This cable is therefore as good as it gets outside a lab and very low loss. You can consider some of these traces close to lab quality. Comcast has since confirmed my results in their lab.
Another objection I’ve heard is that ICMP ping is not “reliable”. This may be true if pinging a particular node when loaded, as it may be handled on a node’s slow path. However, it’s clear the major packet loss is actual packet loss (as is clear from the TCP traces). I personally think much of the “lore” that I’ve heard about ICMP is incorrect and/or a symptom of the bufferbloat problem. I’ve also worked with the author of httping, so that there is a commonly available tool (Linux and Android) for doing RTT measurements that is indistinguishable from HTTP traffic (because it is HTTP traffic!), by adding support for persistent connections. In all the tests I’ve made, the results for ICMP ping match that of httping. But TCP shows the same RTT problems that ICMP or httping does in any case.
What’s happening here?
I’m not a TCP expert; if you are a TCP expert, and if I’ve misstated or missed something, do let me know. Go grab your own data (it’s easy; just an scp to a well provisioned server, while running ping), or you can look at my data.The buffers are confusing TCP’s RTT estimator; the delay caused by the buffers is many times the actual RTT on the path. Remember, TCP is a servo system, which is constantly trying to “fill” the pipe. So by not signalling congestion in a timely fashion, there is *no possible way* that TCP’s algorithms can possibly determine the correct bandwidth it can send data at (it needs to compute the delay/bandwidth product, and the delay becomes hideously large). TCP increasingly sends data a bit faster (the usual slow start rules apply), reestimates the RTT from that, and sends data faster. Of course, this means that even in slow start, TCP ends up trying to run too fast. Therefore the buffers fill (and the latency rises). Note the actual RTT on the path of this trace is 10 milliseconds; TCP’s RTT estimator is mislead by more than a factor of 100. It takes 10-20 seconds for TCP to get completely confused by the buffering in my modem; but there is no way back.
Remember, timely packet loss to signal congestion is absolutely normal; without it, TCP cannot possibly figure out the correct bandwidth.
Eventually, packet loss occurs; TCP tries to back off. so a little bit of buffer reappears, but it then exceeds the bottleneck bandwidth again very soon. Wash, Rinse, Repeat… High latency with high jitter, with the periodic behavior you see. This is a recipe for terrible interactive application performance. And it’s probable that the device is doing tail drop; head drop would be better.
There is significant packet loss as a result of “lying” to TCP. In the traces I’ve examined using The TCP STatistic and Analysis Tool (tstat) I see 1-3% packet loss. This is a much higher packet loss rate than a “normal” TCP should be generating. So in the misguided idea that dropping data is “bad”, we’ve now managed to build a network that both is lossier and exhibiting more than 100 times the latency it should. Even more fun is that the losses are in “bursts.” I hypothesis that this accounts for the occasional DNS lookup failures I see on loaded connections.
By inserting such egregiously large buffers into the network, we have destroyed TCP’s congestion avoidance algorithms. TCP is used as a “touchstone” of congestion avoiding protocols: in general, there is very strong pushback against any protocol which is less conservative than TCP. This is really serious, as future blog entries will amplify. I personally have scars on my back (on my career, anyway), partially induced by the NSFnet congestion collapse of the 1980′s. And there is nothing unique here to TCP; any other congestion avoiding protocol will certainly suffer.
Again, by inserting big buffers into the network, we have violated the design presumption of all Internet congestion avoiding protocols: that the network will drop packets in a timely fashion.
Any time you have a large data transfer to or from a well provisioned server, you will have trouble. This includes file copies, backup programs, video downloads, and video uploads. Or a generally congested link (such at a hotel) will suffer. Or if you have multiple streaming video sessions going over the same link, in excess of the available bandwidth. Or running current bittorrent to download your ISO’s for Linux. Or google chrome uploading a crash to Google’s server (as I found out one evening). I’m sure you can think of many others. Of course, to make this “interesting”, as in the Chinese curse, the problem will therefore come and go mysteriously, as you happen to change your activity (or things you aren’t even aware of happen in the background).
If you’ve wondered why most VOIP and Skype have been flakey, stop wondering. Even though they are UDP based applications, it’s almost impossible to make them work reliably over such links with such high latency and jitter. And since there is no traffic classification going on in broadband gear (or other generic Internet service), you just can’t win. At best, you can (greatly) improve the situation at the home router, as we’ll see in a future installment. Also note that broadband carriers may very well have provisioned their telephone service independently of their data service, so don’t jump to the conclusion that therefore their telephone service won’t be reliable.
Why hasn’t bufferbloat been diagnosed sooner?
Well, it has been (mis)diagnosed multiple times before; but the full breadth of the problem I believe has been missed.The individual cases have often been noticed, as Dave Clark did on his personal DSLAM, or as noted in the Linux Advanced Routing & Traffic Control HOWTO. (Bert Huber attributed much more blame to the ISP’s than is justified: the blame should primarily be borne by the equipment manufacturers, and Bert et. al. should have made a fuss in the IETF over what they were seeing.)
As to specific reasons why, these include (but are not limited to):
- We’re all frogs in heating water; the water has been getting hotter gradually as the buffers grow in subsequent generations of hardware, and memory has become cheaper. We’ve been forgetting what the Internet *should* feel like for interactive applications. Us old guy’s memory is fading of how well the Internet worked in the days when links were 64Kb, fractional T1 or T1 speeds. For interactive applications, it often worked much better than today’s internet.
- Those of us most capable of diagnosing the problems have tended to opt for the higher/highest bandwidth tier service of ISP’s; this means we suffer less than the “common man” does. More about this later. Anytime we try to diagnose the problem, it is most likely we were the cause; so we stop what we were doing to cause “Daddy, the Internet is slow today”, the problem will vanish.
- It takes time for the buffers to confuse TCP’s RTT computation. You won’t see problems on a very short (several second) test using TCP (you can test for excessive buffers much more quickly using UDP, as Netalyzer does).
- The most commonly used system on the Internet today remains Windows XP, which does not implement window scaling and will never have more than 64KB in flight at once. But the bufferbloat will become much more obvious and common as more users switch to other operating systems and/or later versions of Windows, any of which can saturate a broadband link with but a merely a single TCP connection.
- In good engineering fashion, we usually do a single test at a time, first testing bandwidth, and then latency separately. You only see the problem if you test bandwidth and latency simultaneously. None of the common consumer bandwidth tests test latency simultaneously. I know that’s what I did for literally years, as I would try to diagnose my personal network. Unfortunately, the emphasis has been on speed; for example, the Ookla speedtest.net and pingtest.net are really useful; but they don’t run a latency test simultaneously with each other. As soon as you test for latency with bandwidth, the problem jumps out at you. Now that you know what is happening, if you have access to a well provisioned server on the network, you can run tests yourself that make bufferbloat jump out at you.
https://gettys.wordpress.com/2010/12/06/whose-house-is-of-glasse-must-not-throw-stones-at-another/
